What is Observability? A Comprehensive Exploration from Legacy Monitoring to Modern Cloud-Native Infrastructures
In This Article
What is Observability?
In today’s complex digital landscape, traditional monitoring tools and techniques are no longer enough to ensure system reliability, performance, and user satisfaction. The rise of microservices, Kubernetes-based infrastructures, and complex 5G core networks has introduced an era where visibility into system behaviour must transcend simple metrics and static dashboards. Instead, it must offer deep insights into the “unknown unknowns” of production environments. This is the domain of Observability—a holistic approach that allows Engineers, Architects, and Technology Leaders to gain actionable intelligence from the data their systems produce. Observability is not just a new buzzword; it’s a framework and a set of best practices designed to understand complex, dynamic environments in real time.
In this article, I aim to provide a thorough explanation of what Observability is, why it is needed, and how it differs from legacy monitoring approaches. We will also discuss its significance in Kubernetes-based infrastructures and explore some 5G telecom core use cases.
History of Observability
The concept of Observability originated in the 1950s when Rudolf E. Kálmán introduced the Control Theory, a branch of engineering focused on system design and analysis. In control theory:
Observability refers to the ability to deduce the internal state of a system based on its external outputs.
Observability began to take off in IT during the 2010s. Companies like Google, Netflix, Twitter, and Facebook started applying it to manage distributed systems and microservices effectively. This shift marked a significant evolution from traditional monitoring practices to more sophisticated observability frameworks that cater to modern computing needs.
Evolution from Monitoring to Observability
Traditional monitoring, born from the need to keep servers and applications running smoothly, focused on predefined metrics and alerts. We set thresholds for CPU usage, memory consumption, and disk space and are notified when these limits get breached. In other words, Traditional Monitoring is about checking the health of systems using predefined metrics and static thresholds. The end goal is to detect known failure conditions and alert operations teams to take appropriate action. This approach works reasonably well for simpler architectures, for example, with monolithic applications. With legacy monitoring, if CPU usage passed 80% or memory usage hit 90%, an alert would trigger. The main problem is that these conditions do not always map to end-user impact or real application performance issues.
Observability, on the other hand, aims to understand the behaviour of complex systems in unpredictable conditions. Instead of merely detecting known issues, Observability helps us discover previously unknown failure modes and emergent behaviour. The three key pillars of Observability—metrics, logs, and traces—combined with continuous profiling, event correlation, and telemetry data form a complete picture. Observability systems often leverage dynamic instrumentation, open standards (like OpenTelemetry), and distributed tracing frameworks. They provide the depth, context, and exploratory capabilities necessary to ask arbitrary questions about the system state.
Where monitoring answers the question, “Is my application up or down?” Observability answers, “What is my application doing, and why?” Observability turns data into actionable insights by enabling ad-hoc queries, correlation of multiple indicators and telemetries, anomaly detection, and data-driven root cause analysis.
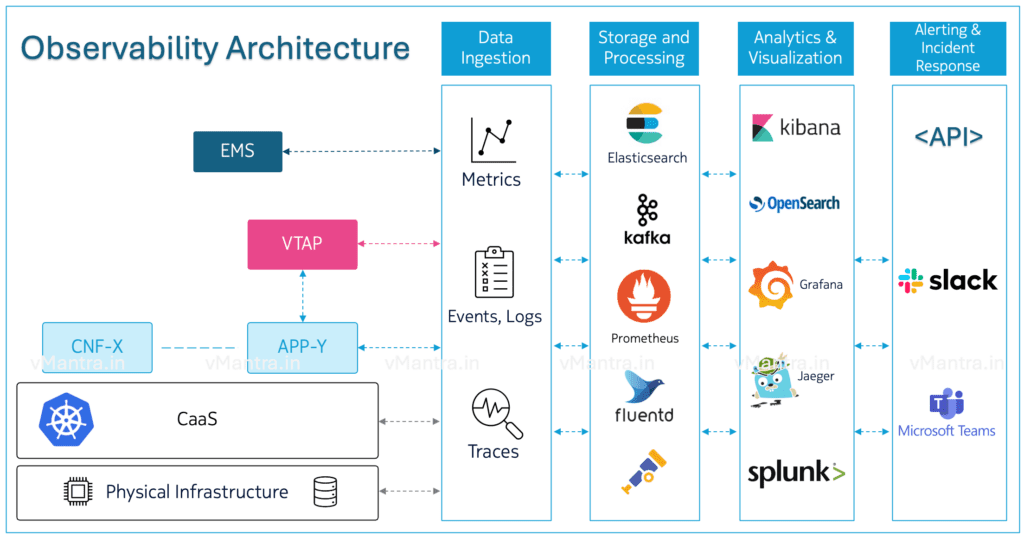
Detailed Architecture of an Observability Stack
A robust Observability architecture in a Kubernetes or 5G core environment typically consists of the following layers:
- Data Ingestion Layer:
- Instrumentation: Use OpenTelemetry or native instrumentation libraries to collect metrics, logs, and traces.
- Agents and DaemonSets: Agents deployed as sidecars or DaemonSets on Kubernetes nodes collect telemetry and forward it to a central backend.
- Service Mesh Integration: Istio or Linkerd provide out-of-the-box telemetry for requests traveling within the mesh.
- Data Storage and Processing Layer:
- Metrics Storage: Prometheus or a scalable backend like Cortex/Thanos for metrics.
- Log Storage and Indexing: Elasticsearch or Loki for logs.
- Trace Backend: Jaeger or Zipkin for distributed tracing.
- Data Correlation Engines: Systems that correlate different data types, enrich telemetry, and maintain a service dependency graph.
- Analysis and Visualization Layer:
- Dashboards and Visualization: Grafana for creating unified dashboards that combine metrics, logs, and traces.
- Query and Analytics Engines: PromQL for metrics queries, Kibana or Grafana Loki for log queries, Jaeger UI for trace exploration.
- ML and AIOps: Integration with anomaly detection tools, ML-based correlation engines, and predictive analytics platforms.
- Alerting and Incident Response:
- Alert Managers: A component like the Prometheus Alertmanager to handle alerts.
- ChatOps Integration: Integrations with Slack, Microsoft Teams, or PagerDuty.
- Runbooks and Automation: Link Observability systems with runbooks and CI/CD pipelines to automate response and remediation.

Techniques for Monitoring and Analyzing Metrics, Logs, Traces, and Telemetry
Observability is grounded in the ability to measure everything. The raw data comes in multiple forms:
- Metrics: Numeric measurements that capture various aspects of system performance (e.g., request latency, CPU usage, packet drops). Metrics are often stored in time-series databases. Tools like Prometheus and InfluxDB are popular choices for metrics collection and storage. Advanced solutions like M3DB or Cortex improve scalability and performance.
- Logs: Immutable, time-stamped records of discrete events. Logs provide contextual details that metrics lack. The challenge is often volume and variability. Stacks like ELK or Loki-Grafana help with ingestion, indexing, and querying logs at scale. Logs can be enriched with metadata to facilitate correlation with other telemetry sources.
- Traces: Traces capture the lifecycle of a single request or transaction as it moves across multiple services. Distributed tracing solutions like Jaeger, Zipkin, or Lightstep allow you to visualize the entire request path, identify where latency is introduced, and map service dependencies. Tracing is crucial in microservices architectures and Kubernetes-based deployments.
- Continuous Profiling and eBPF: Beyond metrics, logs, and traces, newer techniques involve continuous profiling and kernel-level telemetry using tools like eBPF (Extended Berkeley Packet Filter). These provide granular insights into CPU cycles, memory allocation, and network calls without instrumenting code at the application level. This technique is especially useful for anomaly detection, performance tuning, and understanding system-level issues that metrics and logs might miss.
Data Storage and Analysis
Storing and analyzing Observability data effectively is a major challenge. With hundreds of services producing millions of events, petabyte-scale data systems become the norm.
- Time-Series Databases (TSDBs): Metrics are usually best stored in highly optimized TSDBs. Prometheus leverages its own internal TSDB, while open-source projects like Thanos, M3, and Cortex enable scaling metrics storage horizontally.
- Log Aggregation and Indexing: Elasticsearch and OpenSearch clusters store logs indexed by various fields. For telecom operators and large enterprises, log volumes can become massive, necessitating tiered storage solutions and data lifecycle policies.
- Trace Storage: Traces can be stored in various backends, from Elasticsearch to Jaeger’s native storage options. The focus is often on efficient indexing and retrieval by trace IDs and service names, allowing rapid root cause analysis.
- Correlation and Contextualization: To unlock the full power of Observability, data silos must be broken down. Using unique identifiers such as trace IDs, correlation IDs, or subscriber session IDs in a 5G core context can link metrics, logs, and traces together, enabling a unified view of the system.
Open-Source and Enterprise-Grade Observability Tools
A lot of open-source and commercial tools are available to build a comprehensive Observability stack. The Cloud Native Computing Foundation (CNCF) landscape provides a good starting point.
Open-Source Tools:
- Prometheus: The de-facto standard for metrics in cloud-native environments, providing a powerful query language (PromQL) and integrations with Kubernetes.
- Grafana: A visualization platform that can integrate with metrics, logs, and traces from various backends. It supports dashboards, alerting, and plugins for correlation.
- Jaeger: An open-source, CNCF-graduated project for distributed tracing. Jaeger helps visualize request flows and identify latency bottlenecks.
- OpenTelemetry: A unified standard for instrumentation, OpenTelemetry defines APIs and SDKs for metrics, logs, and traces, ensuring vendor neutrality and interoperability.
- Loki: A horizontally scalable, low-cost log storage system from Grafana Labs that index labels rather than log content, making it more efficient for large-scale log ingestion.
Enterprise Tools:
- Datadog: A SaaS platform offering metrics, logs, traces, RUM (Real User Monitoring), and APM (Application Performance Monitoring), integrated with ML-driven analysis.
- Splunk Observability Cloud: Combines metrics, logs, and traces with analytics and ML for large-scale enterprises, including robust correlation and RCA capabilities.
- Dynatrace: Uses AI-driven analytics (Davis AI) for automatic root cause detection and anomaly detection, well-suited for complex enterprise environments.
- New Relic: A unified Observability platform integrating telemetry data from various sources and applying ML to detect issues proactively.
- Cisco Full-Stack Observability (AppDynamics + ThousandEyes): Targets network-to-application performance visibility, useful for hybrid and multi-cloud telecom scenarios.
Observability in Kubernetes-Based Infrastructure
The advent of Kubernetes and cloud-native patterns has accelerated the need for Observability. Kubernetes orchestrates containers across clusters of nodes, often spread across multiple regions. Applications (CNFs in Telcos) are typically composed of dozens or even hundreds of microservices. In such a dynamic environment, container instances may appear or disappear rapidly due to scaling events, deployments, or failures.
Challenges in Kubernetes Environments:
- Ephemeral Workloads: Containers are short-lived, making it difficult to rely on host-level monitoring.
- Dynamic Service Discovery: Services are constantly coming and going; manual configuration is not practical.
- Contextual Complexity: A single user request might traverse multiple services, each producing its own metrics and logs.
- Multi-Cluster and Multi-Cloud: Applications often span multiple clusters or clouds, increasing complexity.
Best Practices for Implementing Observability in Kubernetes
- Utilize OpenTelemetry: This open-source framework helps standardize the collection of telemetry data across various services running in Kubernetes.
- Implement Distributed Tracing: Tools like Jaeger or Zipkin can trace requests across microservices, helping identify latency issues or errors.
- Leverage Metrics Aggregation Tools: Solutions like Prometheus can collect metrics from various sources within the Kubernetes ecosystem for centralized analysis.
- Integrate Logging Solutions: Use structured logging with tools like Fluentd or ELK Stack (Elasticsearch, Logstash, Kibana) to aggregate logs from multiple containers.
By adopting Observability tools designed for cloud-native architectures, engineers can answer complex questions: “Why is the UE Registration slow only during peak hours?” or “Which service caused the cascading failure following the last deployment?”
Use Cases in Telecom 5G Core Networks
The 5G core is based on a service-based architecture (SBA) that decomposes traditional, monolithic network functions into smaller, interoperable and cloud-native network functions called CNFs. This shift introduces an unprecedented complexity level: a single subscriber’s data session might traverse dozens of microservices of a 5G core ecosystem.
Key Observability Use Cases in a 5G Core:
- Network Slice Performance: In 5G, different network slices offer various QoS guarantees. Observability helps telecom operators ensure each slice meets strict SLA requirements for latency, bandwidth, and reliability. Through metrics and distributed tracing, it’s possible to identify if a particular slice is underperforming and pinpoint which CNF is responsible.
- Real-Time Fault Detection and Isolation: With Observability, operators can correlate Anomalies in control-plane signalling with performance degradation in the user plane. For example, in Packet Core, Logs, metrics, and traces from the Access and Mobility Management Function (AMF), Session Management Function (SMF), and User Plane Function (UPF), as well as from the underlying infrastructure, help isolate faults quickly.
- Resource Planning and Optimization: Observability provides insights into CPU, memory, and network utilization at a granular level. By analyzing these signals, operators can improve resource allocation dynamically, scaling particular network functions (CNF or VNF) up or down as needed.
- Security and Compliance Monitoring: 5G networks handle sensitive subscriber data. Observability solutions can integrate with SIEM (Security Information and Event Management) tools to detect anomalies and intrusion attempts in near real time.
- Service Assurance: Observability in 5G is not limited to measuring node-level health. It extends to ensuring the end-to-end subscriber experience, correlating RAN (Radio Access Network) events, Core Network performance, and application-layer KPIs.
Event Correlation, Root Cause Analysis, and Anomaly Detection
At this point, we have learned that Observability isn’t just about collecting data; it’s about making sense of it. In Telecom, Observability solutions offer advanced features like Anomaly Detection, Event Correlation, and Root Cause Analysis (RCA).
- Anomaly Detection: ML-driven anomaly detection tools analyze historical data to establish a baseline for normal behaviour. Deviations from these baselines, such as sudden spikes in call drops or unusual latency patterns in a Kubernetes service, can trigger proactive alerts. AIOps platforms integrate Observability data with ML algorithms to predict and mitigate issues before they impact the end-user.
- Event Correlation: By correlating events (alerts, logs, metrics spikes) across multiple data sources, engineers can reduce alert fatigue and focus on the most critical issues. Tools leverage machine learning to identify patterns, detect duplicate alerts, and group related alerts into actionable incidents.
- Root Cause Analysis (RCA): RCA tools traverse service dependency graphs and evaluate telemetry signals to pinpoint the root cause of an incident. For instance, if user-plane traffic drops after a change in a specific CNF, RCA tools can quickly find the culprit by correlating latency increases in upstream components and error logs in downstream components.
Future Path of Observability
As systems grow increasingly complex and distributed, the future of Observability will be shaped by integrating with GenAI and open-source technologies:
- Consolidation of Standards and Protocols:
The OpenTelemetry project already provides a vendor-neutral standard for instrumentation. Over time, we can expect wider adoption and stability of these standards, making it easier to switch between tools and platforms without re-instrumentation. This will foster a healthier ecosystem with plug-and-play components. - Increased Use of AIOps:
Manual correlation and analysis of Observability data are labour-intensive. The future will see AIOps take center stage, where ML algorithms continuously learn patterns in telemetry and proactively detect issues, recommend remediation steps, and even autonomously resolve incidents. This evolution will free engineers from mundane triaging and allow them to focus on strategic improvements. - Deeper Integration with DevOps and GitOps:
As Observability matures, it will become more tightly integrated into the software development lifecycle. From shifting left to provide developers with immediate feedback on the performance and reliability impact of their changes to incorporating Observability data into GitOps workflows, future infrastructure will see Observability woven into every step of the pipeline. - Focus on Context-Rich Telemetry:
Future Observability solutions will capture more context, like metadata about deployments, code commits, feature flags, and user behaviour. With richer context, correlation and RCA will become even more powerful, enabling near-instantaneous detection of what changed, who changed it, and why it matters. - Expansion into Edge and IoT:
As 5G enables massive IoT deployments and edge computing becomes mainstream, Observability practices will expand beyond the datacenter into the network edge. Lightweight, distributed Observability agents and federated telemetry analysis solutions will emerge to handle these new environments. - Canary Upgrades: Observability is essential for Canary upgrades as it provides essential insights and data to ensure successful and controlled rollouts of new features or upgrades and helps the delivery team make informed decisions.
Conclusion
Observability is no longer a luxury but a necessity for modern IT and telecom infrastructures. It empowers teams to build resilient, high-performing systems while ensuring customer satisfaction. By leveraging advanced techniques and tools, businesses can ensure robust system performance, optimize resource utilization, and enhance user experiences across diverse environments.
Check out some more blogs:
- Understanding Kubernetes Versions
- OpenShift 101: An Overview of the Red Hat OpenShift
- The ABC of SDN (Software-Defined Networking)
- Deploying AWS Greengrass on VMware vSphere
- VNF Manager vs NFV Orchestrator (VNFM vs NFVO)
- Network Functions Virtualization (NFV)
- What is Hyper-Threading?
- Data Center 101: Choosing The Right One For Your Business
- OpenStack Stein ready for 5G, NFV and MEC


